How to Analyze an investment? -Apple vs the S&P 500 Index

26th April 2021

When you have $1 to invest, how do you consider veering away from the tried and tested index? In this blog we’re going to compare returns from Apple to the S&P 500 index. We’re going to look at performance over 1, 5 year periods and then since IPO of Apple.

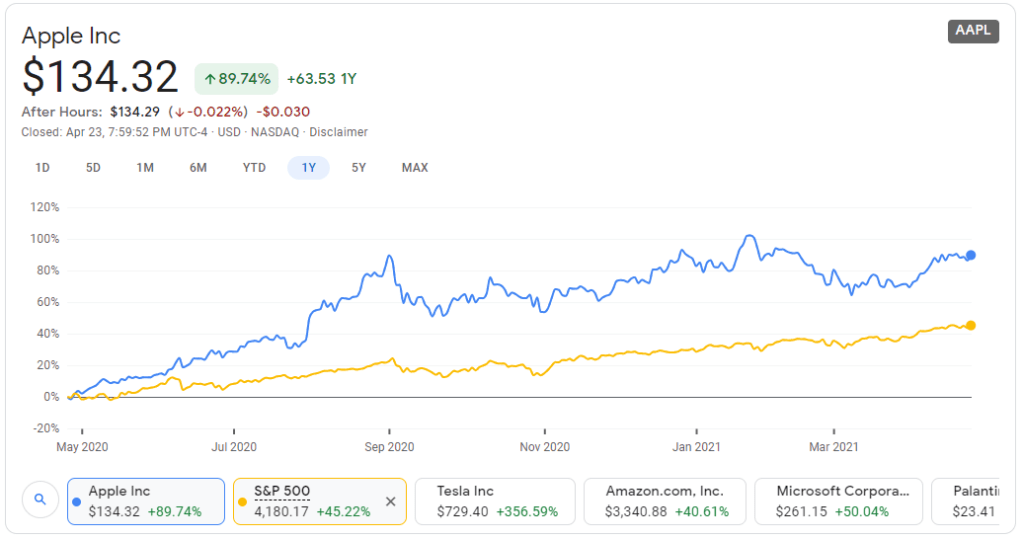
1 year comparison of Apple vs S&P 500 Index (as of 26th April 2021)

Apple share price compared to the S&P 500 Index over 1 year
Source: Google Finance

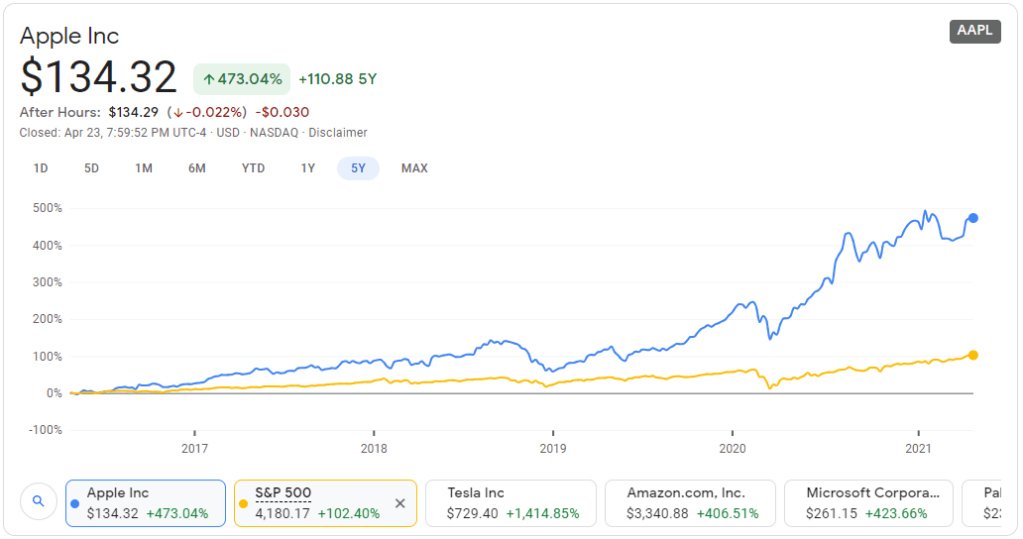
5 year comparison of Apple vs S&P 500 Index (as of 26th April 2021)

Apple share price compared to the S&P 500 Index over 5 years
Source: Google Finance

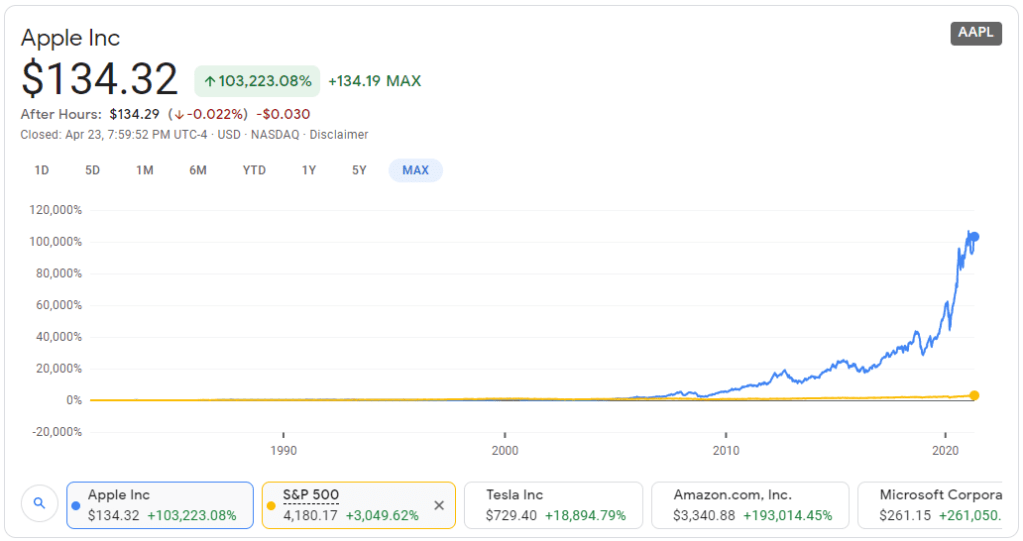
Apple, Max time span, vs S&P 500 Index (as of 26th April 2021)

Apple share price compared to the S&P 500 Index over maximum allowable comparison
Source: Google Finance

As you can clearly see, Apple wins out over the index on every occasion. So how do the major financial ratios compare when assessing the 2;

Assessment of Apple –

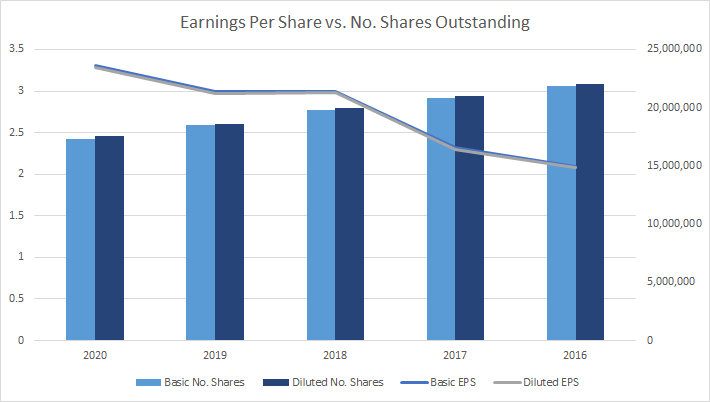
Apple clearly has a structured share buy back plan in place compared to the relatively flat earnings.

Apple's sales vs income comparing 2020 with 2016
Source: https://investor.apple.com/investor-relations/default.aspx#tabs_content–2021

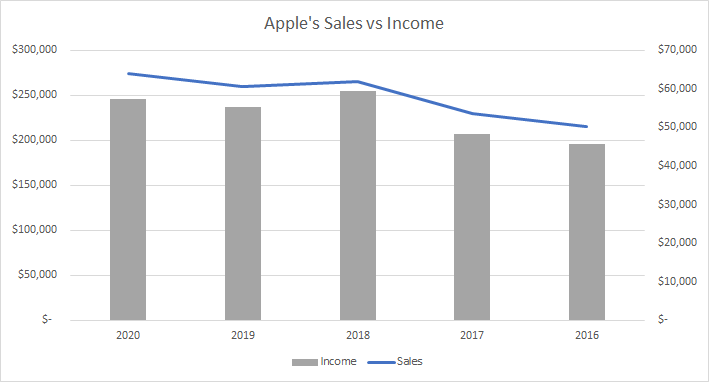
As such over the past 5 years Apple’s bucket of distributable Income has increased by circa 26% and at the same time the Number of Shares available has decreased by circa 20%. As such if you were a shareholder for the full 5 years you would have received about 58% of distributable Income growth across that period (i.e. 126%/80%). That equates to about 9% per annum compound interest Income growth.

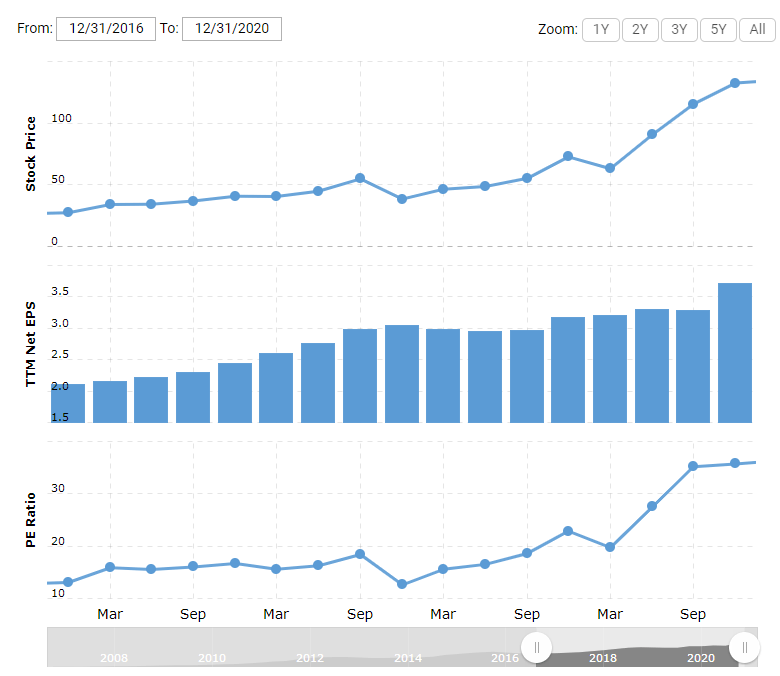
In the meantime the Apple share price rose from $28.95 at the beginning of 2017 to $133.72 at the end of 2020 – circa 462% increase.

Therefore while we’ve seen a large spike in the share price, it has currently outpaced the earnings leading to a higher Price to Earnings ratio (or P/E ratio). The last time Apple had a P/E ratio at this level was in late 2007 just before the Global Financial Crisis.

Apple 5 year Price to Earnings ratio 31 December 2016 to 31 December 2020
Source: https://www.macrotrends.net/stocks/charts/AAPL/apple/pe-ratio

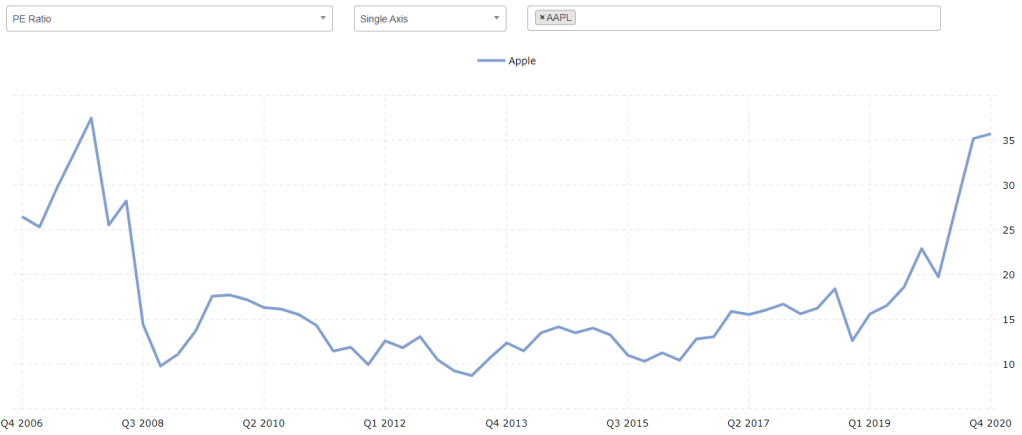
The below graph shows the PE spike prior to the GFC and the current PE. Based on this information we can start to see that the market is currently placing a lot more future value on Apple compared to the past 12 years. But what’s changed?!

Historical Apple Price to Earnings ratio 2006 to 2020
Source: https://www.macrotrends.net/stocks/stock-comparison?s=pe-ratio&axis=single&comp=AAPL

Let’s compare the S&P500 Index’s fundamentals.

Since COVID-19 hit, we’ve seen a hard hit to earnings. This has meant that whilst earnings have dropped off a cliff, the S&P 500 has continued to rise causing a large gap between Price and Earnings. Overtime we can always expect a ‘reversion to the mean’ and at this point to quote the great man Benjamin Graham, in the short term the stock market is a voting machine and in the long term it is a weighing machine.

https://www.macrotrends.net/1324/s-p-500-earnings-history

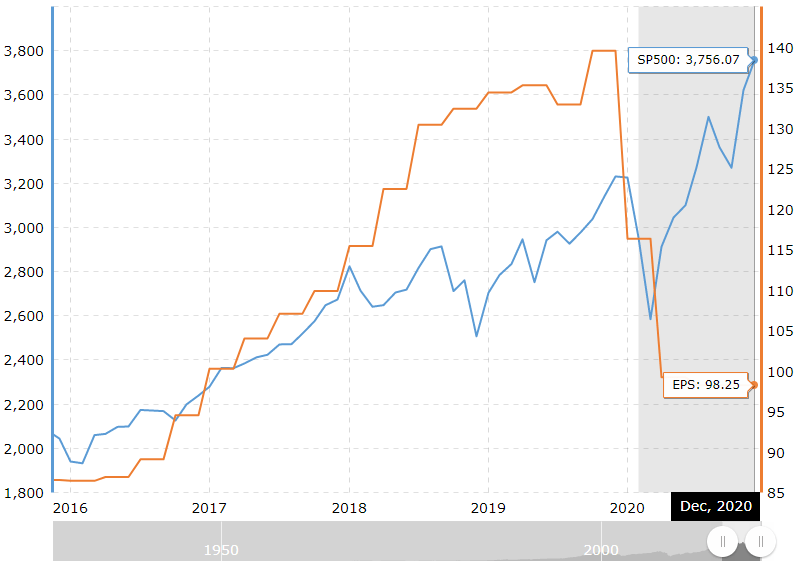
Whilst it’s true that Earnings have been hit, the market is basically temporarily turning a blind eye to the dip. As such if the earnings dip in the S&P500 continues then we’ll start to see pressure on prices.

Summary:

  1. Apple has outperformed the S&P500 over all time frames; 1 year, 5 years and over the long term
  2. Earnings during COVID times have been stable growth for Apple and have hit the S&P500 hard.
  3. The market has pushed Apple’s share price up over 400% in capital value in the past 5 years, whereas a similar investment in the S&P500 would have only increased a tad over 80%.
  4. Apple has a structured buy back program in place whereas the S&P 500 is dependent upon all entities deciding on buy backs.
  5. Apple has a much higher level of market risk compared to the S&P 500 (1 business vs 500 businesses), however for the higher level of risk there is a potential for higher return over the long term.
  6. Generally both Apple and the S&P 500 are trading a multiples much higher than their historical average Price to Earnings ratio. Caution!
  7. When you’re looking at 1 company as an investment always ask yourself – will these products (and any future products they have in the pipeline) continue to sell as well as they are selling right now. If you invest in a single company there’s always a risk it’s products may go off the boil – whereas the S&P500 always adjusts for the largest 500 companies in the US.

How to Find Out Your Financial Position?

Benefits of Finding Out Your Financial Position

  • Allows you to plan your pathway forward
  • Gives you the ability to see how you are improving
  • A one stop shop for comparing against the market
  • Puts a spotlight on expensive debt like Credit Cards
Concept of harmony and balance. Balance stones against the sea.

Procedure:

  1. There are a lot of great apps that can assist you with recording and easily updating your current financial position. These apps connect up bank accounts, allow you to record assets you have (like houses, shares, retirement savings etc.) and also record your liabilities (like mortgages, personal loans, car loans etc.). If you’d prefer not to use an app then you can always use a pen and paper.
  2. The next step is to find ‘Value’ in each of your assets or liabilities. An easy example of this is either by finding a lower mortgage rate for your mortgage or similarly comparing your long term retirement savings account with the long term averages that can be obtained from other fund managers.
  3. The next step is to consider how much cash you have in your arsenal to protect against unknowns out of your control and establish how much you should have on hand. This is often overlooked and people never challenge whether they have too much or too little cash on hand. The excess needs to be considered for investment purposes. Similarly having too little needs a plan to reduce cash outflows from your debt, spending.
  4. Focus on ‘Return On Equity’ or more simply put focus on extending the gap between your assets (shares, houses, retirement savings, business investments) and liabilities (mortgage, personal loans, credit card debt etc.)

How to reduce your monthly expenses without losing lifestyle?

Actively manage:

  • Credit Card debt and other expensive interest debt
  • Constantly trading in and out of stocks/cryptos/currencies/ commodities – the only person you’re making wealthy is your broker
  • Gambling rather than investing – lack of clearly understanding what you put your money into and the risks
  • Administration fees on investments – what appears to be low cost in the short term chews away your compound interest returns

Procedure

  1. Focus on removing expensive credit card debt. It’s near impossible to win at the game of life when you have a credit card debt weighing you down at 18%+. Establish a payment plan to eat away at any credit card debt and if possible refinance your debt into a lower interest rate facility (i.e. extending your mortgage to wipe off credit card debt).

What is Dollar Cost Averaging & is it any good?

Benefits of Dollar Cost Averaging

  • Increasing your investment systematically over time
  • No need to ‘time the market’
  • Applying an autopilot method to your portfolio
  • Long term investing made easy

Procedure

  1. So much time is wasted by investors constantly thinking about the best time to invest. Then when you do invest you worry that the dip you bought will decimate your investment.
  2. Nobody, that’s right NOBODY knows the bottom of the market. Similar to how nobody knows whether next year’s rainfall will be better than this year.

Want to learn more about dollar cost averaging, check out the below books;

John C. Bogle truly is the definition of a man that plants a tree for all people to benefit from the shade in future. His book ‘The Little Book of Common Sense Investing’ clearly outlines the guidelines of dollar-cost averaging over and over again.

Should You Invest in Index Funds?

Benefits of Index Funds

  • Limits your risk by spreading across a number of companies
  • Low management fees
  • Returns in major global indices beat the majority of money managers
  • Long term history
  • Provides a dividend income stream as well as the potential for capital gains
  • Is liquid and can be accessed from anywhere in the world
  • Low transaction fees
  • Long term view

Disadvantages of Index Funds

  • Some indices do not have a critical mass of great companies – shop wisely
  • Volatility of capital value can make people fearful
  • Major global events cause panic
  • Underlying profitability of major companies is difficult to track individually
Design a site like this with WordPress.com
Get started